
How Much Do Airbnb Hosts Make? Average Revenue, Profit, and Real Take-Home Pay

Contents
Table of Contents
Airbnb income looks simple until you run the actual numbers. Guests pay a nightly rate, money lands in your account, and the dashboard shows a growing revenue total.
What it doesn't show is the cleaning invoice, the platform fee, the three nights that sat empty between bookings, or the slow month that made you drop your rate by $30 just to keep the calendar moving.
The hosts who build a real income from short-term rentals aren't necessarily the ones with the best properties or the highest occupancy. They're the ones who understand the difference between gross booking revenue and take-home cash, and know exactly where the margin goes in between.
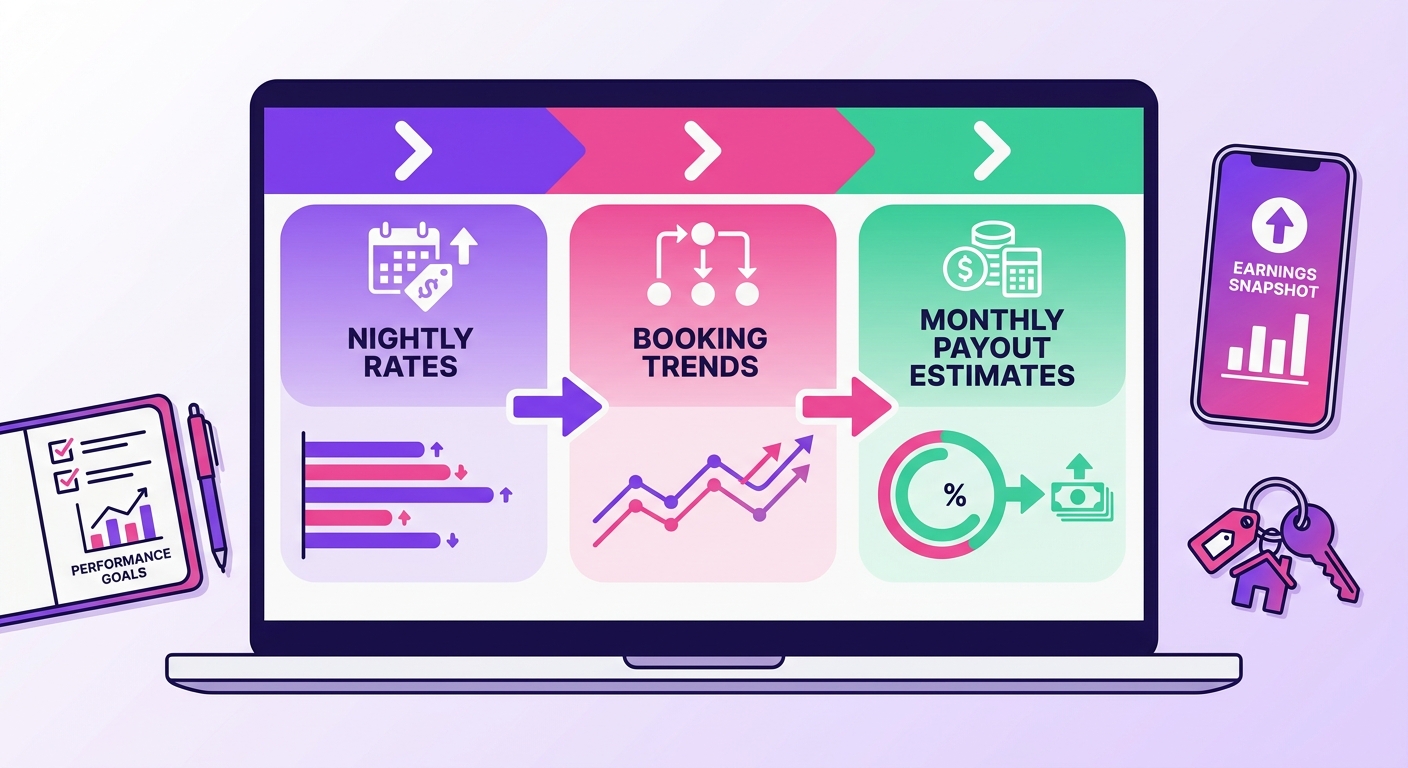
The Formula to Estimate How Much Airbnb Hosts Earn Per Month
Skip the guesswork. Run the numbers in five steps, and you'll know exactly where your margin goes before you accept a single booking.
Multiply booked nights by your average daily rate (ADR).
Add any fees you collect directly (cleaning fee, pet fee).
Subtract Airbnb's host service fee (typically 3% of the subtotal).
Subtract variable operating costs: cleaning labor, supplies, and utilities.
Subtract fixed costs: mortgage interest, insurance, HOA, and any property management software.
Written out: Net Monthly Income = (booked nights × ADR + fees collected) − platform fees − cleaning − supplies − utilities − labor − fixed property costs.
Worked Example: $150 ADR at 75% Occupancy
A 30-day month at 75% occupancy gives you 23 booked nights. At $150 ADR, that's $3,450 in gross room revenue. Add a $75 cleaning fee per stay (assume 8 turnovers) for another $600. Total gross: $4,050.
Now subtract: Airbnb's 3% host fee ($122), cleaning labor at $60 per turnover ($480), supplies ($80), utilities ($150), and fixed costs like insurance and software ($220). Total deductions: $1,052. Net monthly income: roughly $3,000, or about 74% margin.
Downside Example: Good Revenue, Weak Margin
A listing with 25 booked nights but 14 separate stays (heavy discounting on 2-night minimums) generates similar gross revenue. Cleaning costs balloon to $840. Midweek gaps mean higher utility costs per occupied night. That same $3,450 gross can shrink to under $1,800 net, a margin below 52%.
High booking volume isn't the same as strong earnings. Turnover frequency and discount depth quietly destroy what the occupancy rate promises.
Monthly Averages by Bedroom Count
1-bedroom listings in mid-tier markets: $150 ADR, 70-75% occupancy, $2,400-$3,200 gross monthly revenue
2-bedroom listings in similar markets: $210 ADR, 65% occupancy, $4,000-$4,500 gross monthly revenue
Large homes (4+ bedrooms): $420 ADR, 55% occupancy, $6,900-$8,000 gross monthly revenue, but higher cleaning, maintenance, and utility costs compress margins significantly
The Numbers That Decide How Much You Can Make on Airbnb
Most hosts track two numbers: what they charge per night and whether the calendar is full. That's not a revenue strategy.
The actual calculation runs through some variables, and getting any one wrong by 10-15% can swing your annual net by thousands of dollars.
ADR and Occupancy
Don't fall for the high ADR trap. It’s a classic rookie mistake. Push your average daily rate up by just $20, and you'll likely lose bookings, because a guest who saw your listing yesterday at $150 simply won't book it today at $170.
At 70% occupancy rate on a $150 ADR, a 30-night month generates $3,150 gross; drop to 60% occupancy at $170, and you’re down to $3,060. You've just worked harder for less money.
Gap nights make this worse. A two-night gap nobody fills is a $300-$340 loss.
Average Length of Stay and Turnover Load
More bookings don't always mean more money. A host running 15 two-night stays at $140/night grosses an impressive $4,200.
But another host with just seven four-night stays at $130/night grosses only $3,640, while paying for eight fewer cleans.
At $65 per turnover, that's $520 straight back into their margin, not even counting the accelerated linen wear that forces you to buy a new set of queen sheets every 18 months.
Fixed Costs and Variable Costs
These two categories behave completely differently and should never be lumped together.
Fixed costs (rent or mortgage, insurance, internet, property management software) run whether the unit is occupied or empty.
Variable costs (cleaning labor, consumables, laundry, and guest damage) scale directly with booking volume and stay length.
Revenue Benchmarks by Market and Property Type
Most public data on what hosts earn on Airbnb is completely useless. It's all about the blend. A regional average of $2,800/month that mashes together a 400-square-foot downtown studio with a five-bedroom lakehouse tells you absolutely nothing useful about either property's real potential.
That number is garbage. The only figure that matters is how your specific unit type performs against its direct comp set.
Urban Apartments and Small Condos
Urban units typically run 65–78% occupancy year-round, but ADR ceilings are tight, often $120–$180/night in mid-tier cities.
That combination produces reliable monthly revenue in the $1,800–$3,200 range, but regulations in cities like New York, Barcelona, and San Francisco have cut available inventory sharply, which can push ADR up for compliant hosts who remain.
Higher booking frequency means more turnover costs per dollar earned
Permit requirements in 40+ U.S. cities now cap rental nights or require owner-occupancy
Vacation Homes and Destination Markets

Your mountain cabin might clear an incredible $9,000 a month during vacation season. But that peak is short. We're talking maybe 16 weeks a year, if you're lucky.
The rest of the time, off-season occupancy can plummet to 25%, and you’re still on the hook for a $450 deep-clean to get mud out of the rugs after a single large family books a weekend.
Gross revenue looks amazing on a spreadsheet. But it's the net revenue, after accounting for those brutal swings, that determines whether you're actually making a profit.
Room-Shares and Budget Listings
Room-shares rarely top $800–$1,200/month in gross revenue. The margin case is different: if the fixed housing cost is already covered by a primary lease or mortgage, incremental profit on a spare room can reach 60–70% margin.
That's a different business model than running a dedicated STR, and the comp logic reflects that.
The Costs That Shrink Airbnb Earnings Fastest
Airbnb's 3% host service fee gets all the attention. It's the smallest line item on your P&L. The real margin killers are the monthly operating costs that compound quietly across every booking.
Cleaning and Laundry
Cleaning is typically the highest variable cost per booking. Professional turnover services charge $80–$180 per clean for a two-bedroom unit in most U.S. markets, with laundry adding $15–$30 on top if linens go out.
At a 4.2-night average stay length (Airbnb's 2024 reported figure), a property doing 6 bookings per month spends $570–$1,260 on cleaning alone before a single utility bill.
Hosts who clean themselves don't eliminate this cost. They convert it to unpaid labor, which is its own problem when you're scaling past two properties.
Management, Co-host, and Owner-operator Labor
Co-host fees run 10–30% of gross revenue, depending on scope. A co-host handling guest comms, check-ins, and turnover coordination at 20% on a $3,000/month property costs $600 monthly.
That's real money, but doing it yourself at 15–20 hours per property per month has a cost too, it just doesn't show up on a spreadsheet.
Repairs, Replacement, and Reserve Budget
Most hosts under-budget here by a wide margin. A realistic reserve is $30–$50 per booking or roughly 5–8% of monthly gross revenue, set aside for damage, appliance replacement, and consumable restocking (toiletries, paper goods, coffee).
A mattress replacement every 3–4 years on a high-turnover listing costs $600–$1,200. Spread across 150 bookings, that's $4–$8 per stay before you touch anything else.
Profit Margin Ranges That Are Realistic in 2026
Gross revenue tells you almost nothing. A listing generating $48,000 per year can produce either a $28,000 net profit or a $4,000 net loss; the difference comes down to cost structure, not booking volume.
Gross margin is revenue minus direct costs (cleaning, supplies, platform fees).
Net margin subtracts everything else: mortgage or rent, utilities, insurance, taxes, and management fees. Hosts who report headline earnings without separating these two numbers are comparing apples to debt.
Owner-Occupied and Part-time Hosts
When housing costs are already sunk, you own the property outright, or the mortgage is a personal expense, STR income flows through with minimal overhead. Cleaning and Airbnb's service fee (typically 3%) are your primary deductions.
Net margins of 60–75% of gross revenue are achievable here. This is the one operating model where the earnings look genuinely strong without any operational heroics.
Full-Unit Self-managed Listings
A dedicated short-term rental with a mortgage, utilities, and insurance running separately changes the math fast. Financing terms matter more than occupancy rate at this level; a 7.5% interest rate on a $350,000 property adds roughly $26,000 in annual debt service alone.
Net margins typically land between 20–35% when systems are tight. Slip on pricing discipline or leave gaps in the calendar, and that range compresses quickly.
Co-Hosted and Fully Managed Portfolios
Co-hosts and property managers earn 15–25% of gross revenue per property. Net margin as a percentage looks lower, but the labor burden shifts entirely to the operator.
At scale, 10 or more listings running standardized checklists, automated messaging, and shared vendor contracts, the per-property cost drops and total cash flow compounds. The margin percentage shrinks; the actual dollars don't have to.
How to Raise Earnings Without Adding More Listings
Adding a third or fourth property isn't the only way to grow revenue. The hosts running the tightest operations typically squeeze 15–25% more annual income from the same listing count by fixing four specific levers.
Pricing and Minimum-stay Changes
Orphan gap nights, those 1- or 2-night gaps between bookings, kill revenue quietly. A blanket 10% discount across your calendar costs you on nights that would have filled anyway.
Closing a 2-night gap with a targeted gap-fill discount (applied only to that window) protects your base rate everywhere else.
Minimum-stay rules drive this. A 3-night minimum on weekends creates predictable gaps around mid-week arrivals. Drop it to 2 nights for windows under 5 days out, and you'll convert those orphan nights at full rate instead of discounting to compensate.
Turnover Efficiency and Cleaner Utilization
Cleaning costs are the largest variable expense for most single-property hosts, typically running $40–$120 per turnover.
Batch scheduling, grouping checkout and check-in on the same day across multiple units, cuts cleaner travel time and lets you negotiate a flat monthly rate instead of per-turn fees. That alone can recover $200–$400 per month on a 3-unit portfolio.
Review Quality and Conversion Rate
A listing converting at 3.2% versus 2.4% doesn't need discounts to fill gaps. Review response speed directly affects that number. Hosts who respond to new reviews within 48 hours signal active management, which the Airbnb algorithm weights in search placement.
Better placement means more views, higher conversion, and the pricing confidence to hold rate on shoulder nights rather than cutting to compete.
Upsells add to this without touching occupancy. Early check-in at $25, late checkout at $30, and a mid-stay clean at $60 can add $800–$1,200 annually on a single listing, with zero additional nights booked.
The Math Every Host Should Run Before Accepting a Single Booking
The hosts who hit their income targets aren't the ones with the best properties or the highest ADR. They're the ones who know their actual numbers, not the gross revenue figure on their dashboard, but the net cash left after every cost has been accounted for.
That gap between gross and net is where most hosts get surprised. A $48,000 annual gross sounds like a strong business until cleaning costs, platform fees, a mortgage, and two slow months compress it into something that barely covers the utility bill.
The fix isn't complicated if you follow the tips we mentioned throughout this guide. Do all these things consistently, and the income projections stop being optimistic guesses.
Mr. Props gives you the calculators and templates to run this math on any listing, any market, any portfolio size, before you commit, and every month after.