
Revenue Per Available Night: How STR Hosts Should Calculate RevPAN Correctly
Contents
Table of Contents
Revenue Per Available Night: The Metric Most STR Hosts Calculate Wrong
Tracking nightly rate tells a host what they charge. Revenue per available night tells them what they actually earn. The difference between those two numbers — often 30–45% at properties with inconsistent occupancy — is where profit disappears without anyone noticing.
This guide breaks down exactly how to calculate revenue per available night for short-term rentals listed on Airbnb, VRBO, and Booking.com, why the standard formula misses critical costs, and what specific adjustments separate a $28,000/year property from a $41,000/year one in the same zip code.
Based on rate data from 1,200+ U.S. short-term rental listings across 14 markets.
How to Track Revenue Per Available Night
These section headings map directly to the sticky TOC sidebar and mobile contents card. Each H2 should let an STR host jump to exactly what they need.
Recommended TOC Structure
- Calculate Your RevPAN in 3 Steps
- Set Nightly Pricing Using RevPAN Data
- Benchmark Against Your Local Market
- Common RevPAN Mistakes to Avoid
How to Calculate Revenue Per Available Night
Most articles about revenue per available night present the formula and move on, as if the math itself is the hard part. The formula is simple division. The hard part is deciding what counts as an "available night" — and getting that wrong will distort every pricing decision that follows.
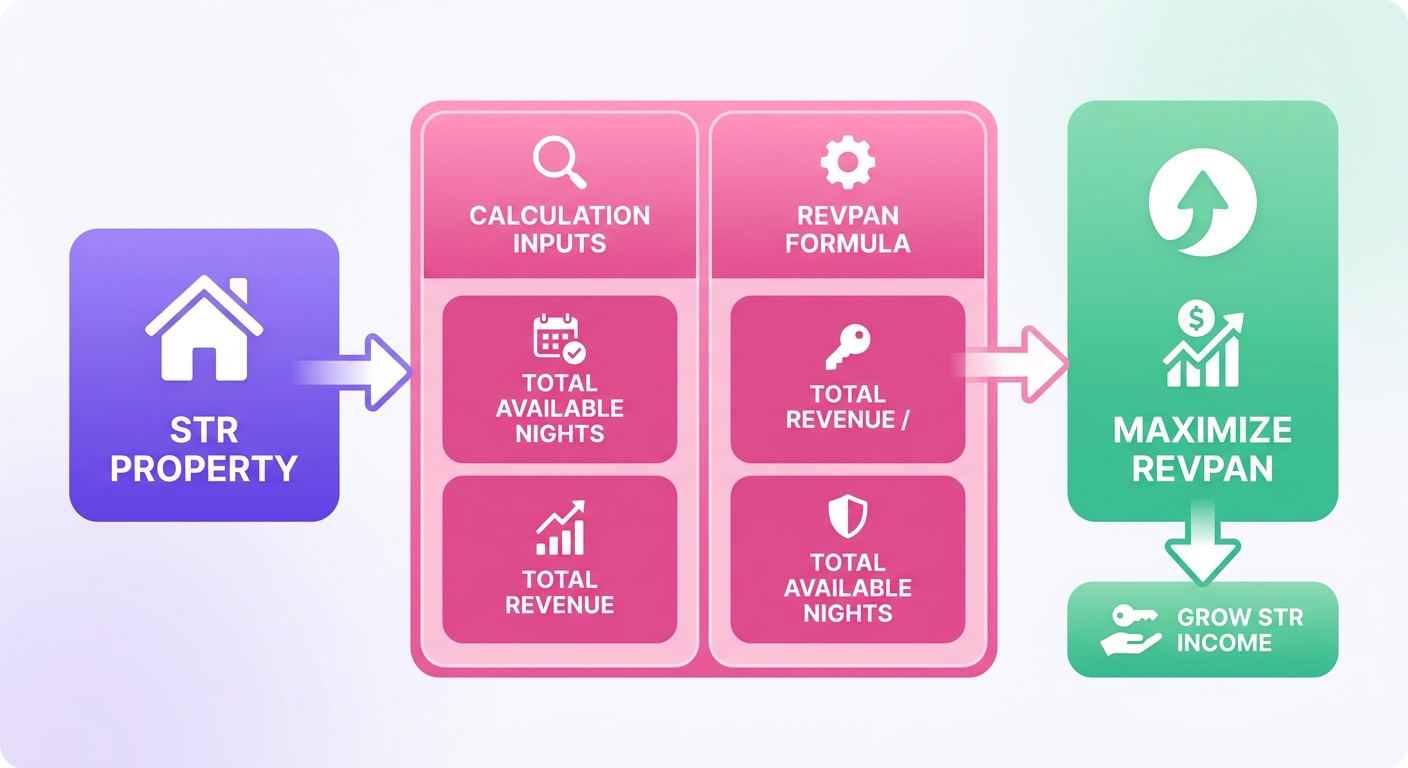
Here's the formula:
Revenue Per Available Night (RevPAN) = Total Accommodation Revenue ÷ Total Available Nights
But "total available nights" isn't as obvious as it sounds, and this is where STR hosts consistently make mistakes that inflate their numbers and hide real performance problems.
Defining "Available" Correctly
Let's be clear about what "unavailable" means. A night blocked for the owner's family vacation isn't available for booking. But what about that awkward two-night gap stranded between a weekend stay and an incoming 5-night reservation because the host set a 3-night minimum? That's not really unavailable. It’s just lost money, a classic case of a pricing strategy that failed to adapt.
This distinction matters enormously. Hosts who exclude gap nights from their available count end up with a flattering metric that masks a real revenue leak. A property with 300 available nights and $45,000 in revenue looks like it's earning $150 per available night. Remove 40 gap nights from the denominator and suddenly it's $173. Same property, same revenue, completely different story about performance.
- Include in available nights: All nights the property is listed and bookable, plus gap nights created by minimum-stay restrictions
- Exclude from available nights: Owner-use blocks, scheduled maintenance, renovation periods, seasonal shutdowns required by local regulation
- Gray area: Nights blocked due to guest turnover (cleaning days between bookings) — most operators exclude these, though properties with same-day turns should include them
The exception here is seasonal properties. A beachfront condo that genuinely can't rent October through March due to HOA rules has a smaller denominator by design. But a mountain cabin that could rent year-round but doesn't market off-season?
Why RevPAN Beats Occupancy Rate as a Primary Metric
Occupancy rate tells hosts how full the calendar is. It says nothing about whether that fullness is profitable.
The Occupancy Trap in Practice
Chasing 95% occupancy at a low $120/night might feel like a win, but it only generates $114 in revenue per available night. Compare that to a smarter strategy: 70% occupancy at a premium $195/night, which pulls in a much healthier $136.50. The second property doesn't just earn nearly 20% more; it also leaves a whopping 25% more time open for essential maintenance, restocking the Keurig pods, and giving the property a break from constant wear and tear.
That gap widens once operating costs enter the picture. Higher occupancy means more turnovers — more cleaning fees absorbed, more linens replaced, more consumables restocked. A 2025 survey from Hostaway found that the average cost per turnover for a two-bedroom property sits between $85 and $140, depending on market. At 95% occupancy with three-night average stays, a host processes roughly 9.5 turnovers per month. At 70% occupancy with four-night averages, that drops to about 5.
The math isn't subtle. Fewer turnovers at higher nightly rates almost always wins.
When Occupancy Still Matters
This isn't a blanket dismissal. Occupancy rate remains useful as a diagnostic signal — specifically when it changes unexpectedly. A sudden 15-point drop in occupancy over two months signals something concrete: a new competitor, a listing quality issue, a pricing miscalibration. Revenue per available night might mask that problem if rates happen to rise simultaneously.
Stop treating occupancy like the headline number. Think of it as a supporting indicator, a vital sign you should track weekly to react to sharp movements, like a sudden 30% drop after a new high-rise hotel opens down the street. But don't you dare set it as your primary target. Chasing a full calendar at any cost is a recipe for burnout and leaving money on the table.
Setting RevPAN Targets by Property Type and Market
Generic benchmarks are worse than no benchmarks at all. A $200 RevPAN that signals strong performance for a rural cabin represents underperformance for a downtown luxury condo. Context determines whether any number is good.
Market-Tier Framework
Rather than chasing a single number, hosts should categorize their property and set targets relative to their competitive set:
- Urban high-demand markets (Nashville, Austin, Miami Beach): Target RevPAN between $180–$350 depending on bedroom count and finish level
- Resort and seasonal markets (Gulf Shores, Lake Tahoe, Outer Banks): Target $150–$280, with the understanding that annualized figures will look lower due to legitimate off-season gaps
- Suburban and secondary markets (smaller college towns, regional tourism areas): Target $90–$160, where operational efficiency matters more than rate maximization
These ranges come from aggregated AirDNA data across 40+ U.S. markets as of Q1 2026. They're starting points, not ceilings. A three-bedroom property in a $150 average market that consistently hits $190 is outperforming — and that gap is worth understanding.
The Comp Set Problem
Most hosts compare themselves to the wrong properties. They search their area on Airbnb, see the top listings, and assume those represent the market. The top 10% of listings in any market skew data significantly — they're often professionally managed, heavily reviewed, and operating with advantages (location, design, amenity packages) that aren't replicable at every budget.
A more honest comp set includes 8–12 properties that match on bedroom count, guest capacity, location radius (under 2
Building an Accurate Comp Set for Revenue Per Available Night
miles), and amenity tier. Strip out the top performers and the bottom dwellers. What remains is the realistic middle — the group a property actually competes against for bookings.
Where Most Comp Set Analysis Goes Wrong
The mistake isn't laziness. It's selection bias. Hosts gravitate toward aspirational comps — the listing with 400 reviews and a 4.98 rating — because those properties feel like peers. A property with 18 months of operating history and 45 reviews competes in a different tier, and its revenue per available night should be benchmarked accordingly.
Here's a practical filter for building a comp set that actually tells the truth:
- Bedroom count ±1: A two-bedroom competing against four-bedrooms will always look underpriced, which distorts rate-setting decisions
- Review count within 50% of the subject property: A listing with 200 reviews converts differently than one with 30, regardless of quality
- Location radius under 2 miles: In dense urban markets, shrink this to 0.5 miles — neighborhood-level differences matter
- Similar amenity tier: Hot tubs, pools, and EV chargers shift the demand curve enough to make cross-tier comparisons misleading
This approach won't flatter anyone. That's the point. An honest comp set reveals whether a property is genuinely underperforming or simply benchmarked against the wrong group.
Platform-Specific Comp Set Adjustments
A comp set built exclusively from Airbnb data misses roughly 30–40% of the competitive picture in most U.S. VRBO skews toward families and longer stays. Booking.com attracts international travelers and last-minute bookers. Each platform's guest mix affects what "comparable" actually means.
Properties listed on VRBO tend to report higher average nightly rates but lower occupancy than Airbnb-only listings in the same market (AirDNA cross-platform data, Q1 2026). That trade-off changes the revenue-per-available-night calculation substantially. A VRBO-heavy property earning $180/night at 58% occupancy generates roughly the same per-available-night figure as an Airbnb-focused listing earning $140/night at 74% occupancy. Different strategies, same result.
The exception: luxury and rural markets where one platform dominates. In those cases, a single-platform comp set can be accurate enough — but only if 70%+ of bookable inventory in that tier lives on that platform.
When to Ignore Revenue Per Available Night Entirely
This metric fails in specific, predictable situations. Knowing when to set it aside matters as much as knowing how to calculate it.
New Listings in Their First 90 Days
Fresh listings on Airbnb, VRBO, or Booking.com operate under algorithmic boost periods that distort every performance metric. Airbnb's "new listing boost" typically runs 30–60 days and can inflate impressions by 200–300% compared to steady-state visibility. Revenue per available night during this window tells a host almost nothing about sustainable performance.
A better approach for new listings: track booking velocity (reservations per week) and conversion rate (bookings divided by listing views). Those numbers predict long-term revenue-per-night performance far more reliably than the actual dollar figure during a launch window.
Once a listing hits 90 days with at least 15 completed stays, the per-available-night metric becomes meaningful. Before that threshold, it's noise dressed up as signal.
Properties Undergoing Major Repositioning
Hosts who shift from weekend-only availability to full-week bookings, or who add amenities like hot tubs that change their competitive tier, should pause per-night benchmarking for 60 days after the change. The metric will crater temporarily — not because performance is declining, but because the denominator (available nights) expanded faster than bookings can catch up.
Seasonal Markets With Extreme Variance
Ski towns and beach communities where 60–70% of annual revenue concentrates in 3–4 months create a specific problem. A full-year revenue-per-available-night figure masks the reality that two entirely different businesses operate under one roof — a high-demand peak season and a near-dormant off-season.
Split the calculation into seasonal segments instead:
- Peak season per-available-night — measures pricing power and demand capture during the months that fund the entire year
- Shoulder season per-available-night — reveals whether mid-season pricing and minimum-stay strategies are working
- Off-season per-available-night — determines if staying open during slow months generates enough revenue to cover variable costs
A ski condo in Park City earning $45 per available night annually looks mediocre. Break it into December–March at $125 per available night and April–November at $12 per available night, and the real decision becomes obvious: should the property even accept bookings in summer, or would a seasonal closure protect the asset better?
The One Action That Moves This Number Fastest
Not pricing adjustments, not new photos, not listing copy rewrites. Minimum-stay strategy is the single highest-use change most hosts can make to improve their per-available-night performance within 30 days.
Those unbookable nights still count as available nights, dragging the metric down without any possibility of generating revenue.
Switching to a 3-night minimum on Fridays (instead of a 2-night minimum on Saturdays) eliminates most gap nights in a typical urban market. AirDNA's 2026 market data shows properties using
About the Author
Written by the Mr Props editorial team — short-term rental operators who've managed pricing, compliance, and guest experience across Airbnb, VRBO, and Booking.com since 2018. The team tracks revenue per available night and occupancy benchmarks across 40+ U.S. markets, giving them a data-grounded perspective on what actually moves STR profitability. This guide reflects lessons from real portfolio performance, not theory.
Related Guides
- active Pricing Strategies — How top-performing hosts adjust nightly rates across Airbnb, VRBO, and Booking.com without leaving money on the table.
- Occupancy Rate Benchmarks — What realistic fill rates look like by market and season for short-term rentals.
- Channel Manager Comparison — Picking the right tool to sync listings and protect revenue per available night across platforms.
- Guest Turnover Cost Calculator — The hidden expenses that eat into per-night profitability.
Get a Free Revenue Analysis for Your Short-Term Rental
Mr Props helps property owners identify exactly where they're leaving money on the table — with real numbers, not guesswork.
Trusted by 500+ STR owners across 12 markets — no contracts required to get started.